
RGB Array bargraph mathematical analyse
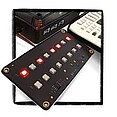
The mathematical analysis to start programming a RGB bargraph on the TI RGB array. The sensor value between 0 and 4096 is divided in a color range from red to orange to yellow and green.
Uitgever: Franklin Neyt, Franklin Neyt
Onderwerp: STEM
Tags Coderen , Complex analysis
To create the colors there is first an increase of green from 0 tot 255 while red is on. Then there is a decrease from 255 to 0 whle green is on. By doing this we are getting the colors RED, ORANGE, YELLOW, LIGHT GREEN and DARK GREEN.